Picture the scene:
It's 10:30pm on Christmas Eve. You're wrapped up warm in this year's hilarious Christmas jumper (it got plenty of laughs from people at the office), you've had just enough mince pies but don't want to move too much in case you realise you've already gained more timber than the Christmas tree in the corner (the twinkling light from which is reflecting off the TV in front of you as you watch Hans Gruber falling from the top of Nakatomi Plaza.) You've notched up at least 100 rounds of Mariah Carey's most enduring hit, and the Christmas break is stretching out in front of you like the endless school holidays you remember from so long ago. Bliss.
And then, from the deep recesses of the sofa you feel it. Ever so quietly at first - you think it could be your imagination. Was that some phantom vibration?
Bzzz. There it is again. This time you hear it too. You fumble for a moment, hand down the side of the cushion before grasping it. Your phone is springing to life. A lock-screen flooded with that damned cheery multi-coloured icon and a series of automated messages.
And now you regret signing up to being on call this Christmas. You brush aside crumbs on your chest from the pies of early-evening and clear your throat to try and enter the zone. You turn to your partner and utter...
I'm sorry dear, it's time for me to troubleshoot our web cluster.
Did that bring you out in a cold sweat? Perhaps it triggered a memory you've tried your hardest to forget.
Nobody wants to be thrust into troubleshooting mode when you're 7 mince pies deep, let alone when you're just about at peak relaxation (before the in-laws have arrived.) But as we know, things break. And they break at very unpredictable times. Having a well-defined process for managing incidents and an on-call rota that works for everyone is key to long-term success. And once you're online and ready to troubleshoot it's essential that you have the tools, data, and access you need to resolve issues as quickly and as painlessly as possible.
So, let's dive into one of the most important parts of operating always-on software at scale: logging and tracing of large-scale software platforms. Specifically, we'll focus on introducing comprehensive logging and tracing to a non-cloud-native application within AWS.
Why?
Thankfully most troubleshooting can happen in normal working hours. Technical Support and Development teams can use logs to better understand issues that end-users might be facing. As services grow and it becomes increasingly costly and time-consuming to find the root causes of problems, logging is a key resource to help enrich your team's understanding. It can also be immensely useful in understanding how to better optimize your service to cut down on the cloud bill.
What?
Tracing usually refers to end-to-end mapping of requests through your infrastructure (normally, across several services) so that you can peer into what goes on under the hood for each request and is generally achieved by using a correlation ID of some sort to tie all metrics and logs together. Patterns and aggregations are then computed from these traces to provide high-level insights, and metrics at each level of the infrastructure. This can help with understanding the behavior of the code or service under the given circumstances (e.g. identifying bugs or understanding oddities), troubleshooting bottlenecks and performance issues (you can see which steps accumulate the most time), and many other things.
Logging is the art of capturing useful information during the runtime of the application in order to help an observer understand what the application is doing - exposing the internal state and control flow for later analysis. This can be used to troubleshoot the application, understand the nature of certain behaviors, or help with the audibility of past events. Unfortunately the engineers writing the logs are rarely those that will rely on them when supporting the application in a support role. This can lead to logs that lack crucial and useful information leading to prolonged troubleshooting and resolution times.
Interact's Approach
Within our product stack we run a large multi-tenanted, monolithic .NET application which already has plenty of logging via Serilog. These logs are sent to ElasticSearch which are, in turn, consumed by Kibana. As a side note: I strongly recommend that you avoid AWS CloudWatch if you value your money - data ingestion costs at scale will outshine your hosting bill!
Like most engineering teams we've taken an iterative approach to implementing logging in this application - baking in our experience trouble-shooting complex scenarios at scale - to enrich our logging and tracing techniques. The monolith is surrounded by several services which generally receive their traffic by using Load Balancer route rules or other proxy services, to split traffic based on the path patterns.
If we were to map out a high level request path into the system (in our case, using an AWS environment) it would look something like below:
(Architecture below assumes a certain setup, including Application Load Balancers, which relay the traffic to several web servers in a target group - generally, these would be controlled by the Auto Scaling Group.)
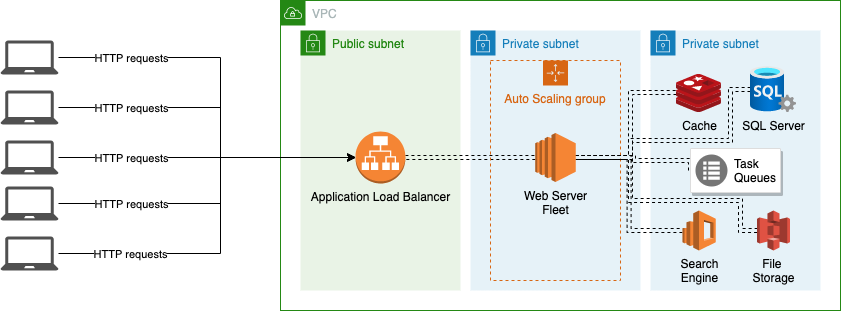
- A request originates from the client devices
- The request reaches the to the Application Load Balancer (ALB)
- The ALB checks its route table and evaluates the rules
- If the rule results in a "Forward traffic to a Target Group", the target group determines which web server will receive this request
- The web server application processes the request (eg. IIS, Nginx, Apache, Express etc.)
- The application code performs the necessary operations on the request - this may involve reaching out to a number of underlying services (especially if the webserver layer is stateless in nature.)
- The application generates a response and passes it back to the webserver application
- The web server returns the response to the Application Load Balancer
- The Application Load Balancer returns the response to the client device
Application Logging
Most of the logging in modern applications happens around step 6, and sometimes 5 and 7 if the relevant configuration is in place. Because of this, we typically rely on application or product engineers to write logging code and without a rigorous set of guidelines for writing good logs, we often either don't get any, or end up with low-value logging.
There are several problems here.
A lot of the time, a singular log message is not particularly useful, and may simply tell you "a problem exists", but not much beyond that. What is truly needed is more context and a lot more information around the request that caused it.
You want a few things to be present in your logging strategy:
- Centralized and easy to access log querying tool (eg. we use ElasticSearch and Kibana - again, stay away from CloudWatch as a log store if you value your money!) - it shouldn't be a quest to simply gain access to the logs - the easier it is, the more people will refer to them.
- Correlation ID in the logs - so that you can tie individual log messages together into a story. Think about 10k requests being logged out simultaneously, you want to be able to tie them together into "stories" and follow each request.
- Proper exception handling and logging - no empty catch statements, correct logging levels being used, alarms in place to notify the relevant people of issues, etc.
- Ambient Context being captured - logging the variables, arguments, and anything useful, at the point of failure, to aid in understanding the failure, and what was inside of the function when it failed. Printing the exception alone is rarely enough, to understand if the issue was a poor implementation, bad data, or a cascaded issue from further up the caller tree (more on this and how we do it, in a future blog post.)
All of these underpin Interact's approach to logging.
We constantly talk about the Christmas Eve scenario and ask our engineers to think from that vantage point. What would you need to know in order to fix this as quickly as possible? What context is important? What if you'd never worked on this part of the application and had no idea what the control flow was?
Tracing with AWS X-Ray
AWS X-Ray provides tracing for distributed applications and yields lots of insights into how your application behaves in development/production, and importantly, how it interacts with other services that it relies on. It is able to gather information and infer relationships between services based on traffic routes across the AWS infrastructure and provide incredibly useful insights and recommendations as well as help you fine-tune your application.
If we refer back to the 9 steps outlined above, X-Ray covers steps 2-9 and can be an extremely powerful tool for debugging issues across multiple services. It does not, however, replace the need for good application logging and should be used as a complementary service.
The integration with the codebase is very light touch and we've found that the value it brings really is worth it.

X-Ray focuses on high-level aggregates, trends, and relationships, but also allows you to drill into specific requests.
It's well-suited to microservice architectures wherein requests are fulfilled by distributed services, and the architecture map clearly models the processes that happen within it (you can see the request path between multiple services, and at which point it fails - it makes the troubleshooting process more visual) - you can also use it with monolithic applications, where a single "service" performs most of the logic.
Whereas in a microservice-based architecture you can quickly navigate the map and find the issue in a specific service which, if small enough, should be easy to troubleshoot and debug, in a monolith the issue is usually going to lie within the application (since this is where most of the magic happens.) What you need here, is robust application logs, that can be correlated with these additional tools, like X-Ray.
Ops Dashboards
We run another instance of ElasticSearch and Kibana to monitor the health of the infrastructure and the overall estate. This contains metrics and information from all the instances, logs from select AWS services or on-instance agents, and a record of all requests that have made it through our AWS Application Load Balancers.
All of this data is used to create a plethora of dashboards, and visualisations, that clearly tells us how healthy the infrastructure is at any point in time as well and multiple weeks into the past which allows us to drawn comparisons, find patterns and analyse events after they have occurred (we don't lose that data post-event.)
The request data from the load balancers is heavily enriched at the point of ingestion. We can use things such the tenant domain names to further determine and attach information about the database server used in the transaction, database name, and specific site characteristics (this allows us to look at characteristics of healthy traffic while looking at shared infrastructure components to find patterns and root causes of issues faster.) We can cross-reference information in the ALB logs with other AWS information such as which specific web server served this request (we can see if any hosts have a higher than normal latency, or error rates), which AMI or software version the instance was running, which load balancer served the request, amongst many other things.
This makes for a very powerful tool to manage a huge deployment serving billions of web requests.
Consolidation using X-Amzn-Trace-Id
The final step is to tie it all together - to extract more value than a simple sum of the pieces.
As an example, what if I want to drill into a request that has resulted in a 500 response code? If I found it on the ops dashboard, I want to find the specific logs in the application logs that belong to this request only. If I was prompted by X-Ray about an increasing error rate, I may want to query the ops dashboard for other patterns that may be infrastructure-related, isolated to a specific customer or load balancer, or I may want to take some sample requests from X-Ray and see what was going on in the application at the point in time, and then circle back to X-Ray and the ops dashboard.
The real value comes from using all 3 tools together.
Being able to do this, gives you powerful forensic capabilities, reduces the first-responder resolution time, and makes for a more transparent experience at scale. You can probe into the issue as it happens or retrospectively post-fact (depending on how long you retain your data.)
The main identifier we share across all our logging, tracing, and ops systems, is the HTTP Header:
X-Amzn-Trace-Id
Logging: We capture this in the application and enrich our Serilog logs with this value - allowing us to query by this value in ElasticSearch and Kibana.
Ops Dashboard: We capture this in the ops dashboards by ensuring we index this value from the Application Load Balancers logs. This allows us to pluck individual requests from the ops dashboards, that contain close to a billion requests in the index at any point in time. We can then use it to refer to the application logs, to inspect exactly what happened.
AWS X-Ray: X-Ray Uses this Trace ID automatically to track requests travelling through the AWS infrastructure and services and is able to model the traces based on that. As you drill into the X-Ray metrics, and reports, you can take these Trace IDs and cross-reference them with the ops dashboard, and the application logs accordingly, providing you with a full picture of what has happened.
It is essential to have a robust observability, logging, and tracing strategy when operating at scale.
These methods have served Interact well, and we hope that you have found it useful and actionable, and hopefully can apply some of it to your own strategy, and benefit from our learnings and experience.
Now, back to mince pies and the only Christmas film that matters...